Uncovering how real-time liquidity and trader sentiment shape price formation beyond traditional chart indicators
Can we adopt the hypothesis that the current crypto market is closely correlated with global financial markets and macroeconomic conditions?
And if that’s true, do we really believe crypto has fully distanced itself from the world’s economic sentiment?
Let’s explore this together.
The Foundation: Supply and Demand
Every market is governed by the same fundamental law- supply and demand.
When demand rises, prices tend to increase; when supply outweighs demand, prices tend to fall.
However, this relationship depends on market elasticity. Some goods react strongly to price changes, while others do not. For example, certain luxury goods are known as Veblen goods — demand for them can actually increase as prices rise, due to their status appeal.
Crypto markets, in contrast, are highly elastic. They respond instantly to shifts in sentiment, liquidity, and macroeconomic pressure.
Rethinking how we observe Supply and Demand
Traditional technical analysis methods often rely on price action, volume profile, or chart-based support and resistance zones.
These tools have been useful for decades, but they all share one limitation — they analyze what has already happened.
In contrast, the order book shows what is about to happen.
It reveals live buy and sell pressure, offering a direct view of supply and demand dynamics before they materialize in the price.
This is the layer of the market where intentions are visible, where traders place bids (demand) and asks (supply), and where the balance between the two begins to form.
In CEX’s most displayed liquidity comes from resting limit orders — orders waiting to be executed or canceled.
While spoofing and noise exist, this data still represents the most immediate insight into trader sentiment and liquidity formation.
Beyond visual “Walls”
When traders examine market depth charts, they often look for “walls” — sharp jumps in order volume that might signal support or resistance.
This approach can work in simple markets but often fails in highly liquid assets like Bitcoin, where spreads are narrow and order clustering is complex.
To move beyond manual inspection, we developed a quantitative Support and Resistance Detection Method that identifies structural levels directly from order book data.
Our approach: Support and Resistance detection from Order Book Data
Our method mathematically analyzes bid and ask quantities to reveal zones of concentrated buying and selling pressure.
These zones represent the true structural levels of supply and demand, rather than the levels inferred from past price action.
By quantifying and visualizing these patterns, we can see how support and resistance form dynamically — as a living structure that evolves with market sentiment.
Below are examples of detected levels.
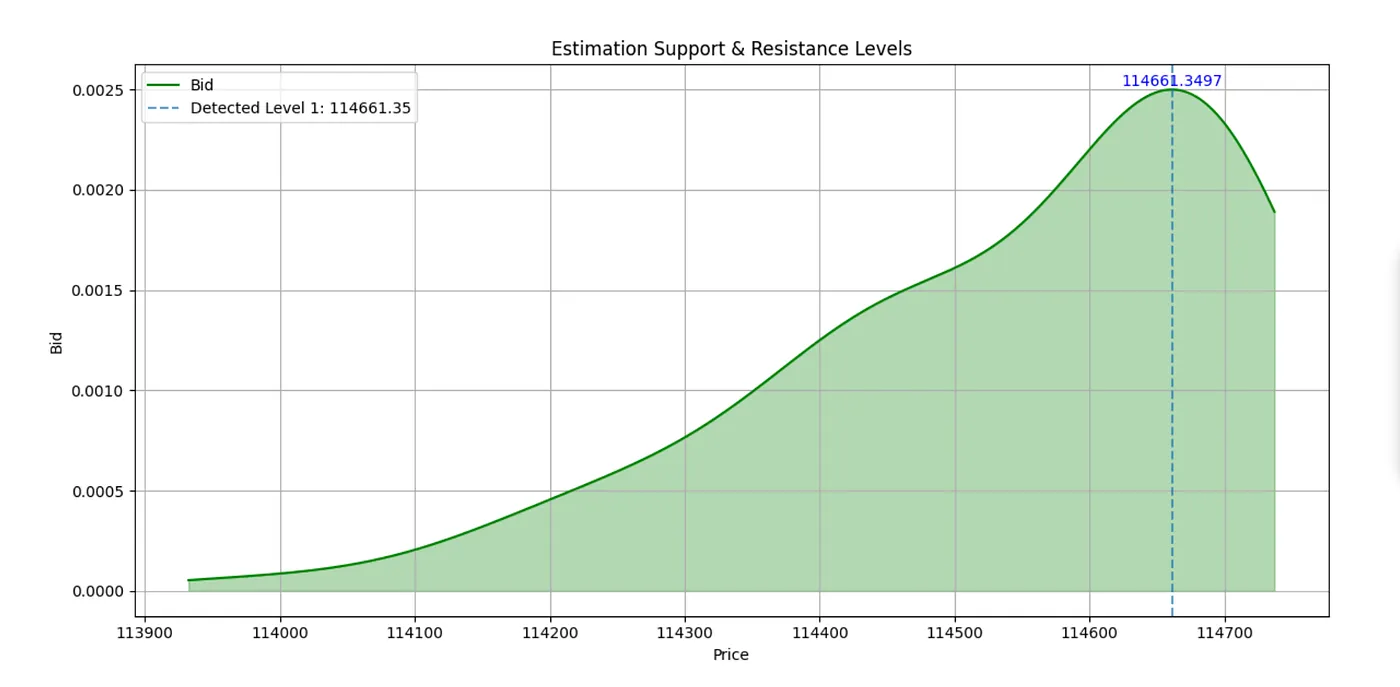
Bid (Support Detection, Spoofing-Filtered)
Here, we identify major support zones, where buyer concentration forms potential price floors.
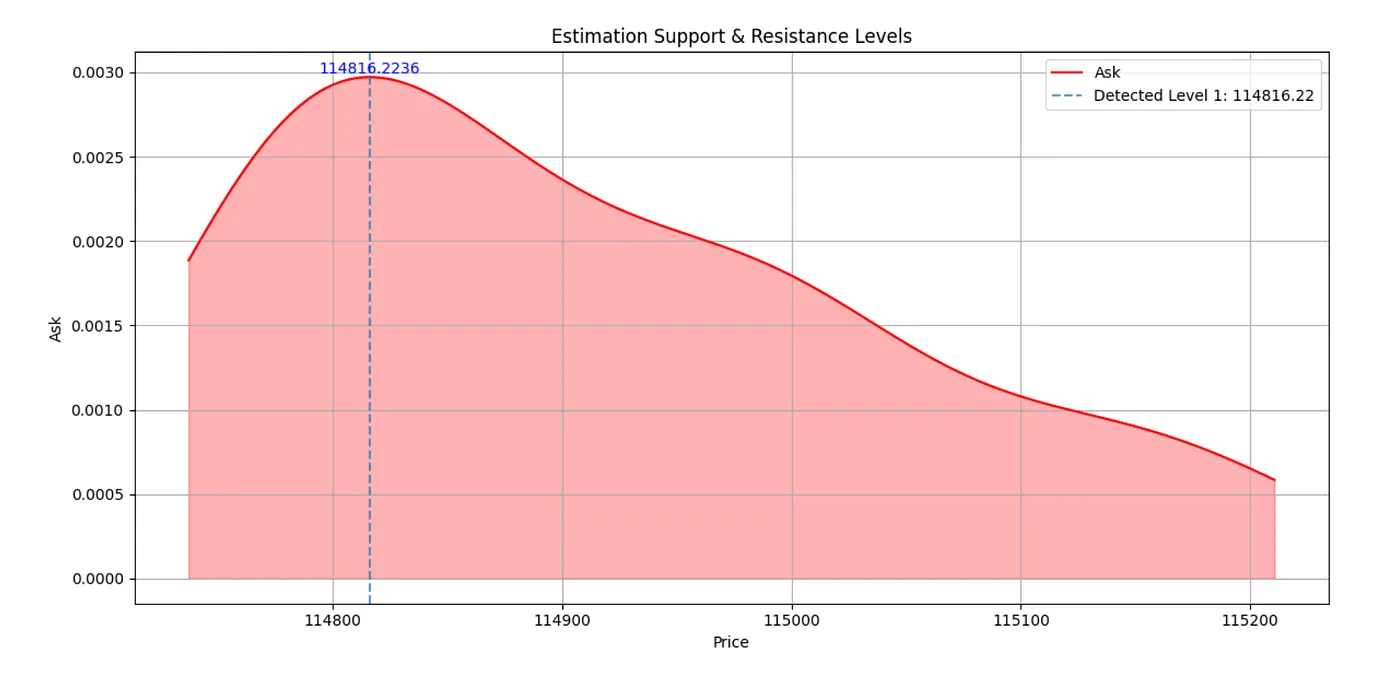
Ask (Resistance Detection, Spoofing-Filtered)
Here, we identify major resistance zones, where sellers are clustering and supply pressure intensifies.
The Order Book Sentiment Indicator
While these detected levels show snapshots of buy/sell intentions, we also need to understand how these pressures evolve over time.
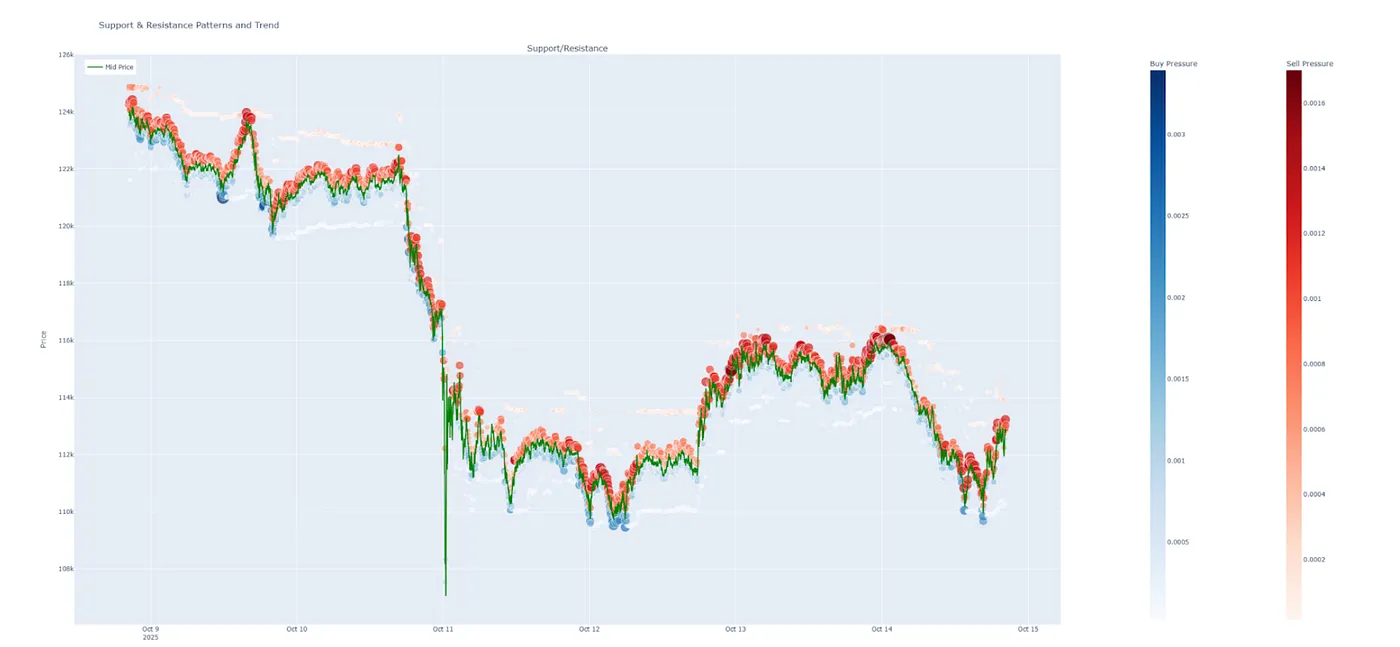
To achieve this, we developed the Order Book Sentiment Indicator — a visualization that displays dynamic buy and sell pressure around the current traded price.
- Blue circles represent bid-side (buy) pressure.
- Red circles represent ask-side (sell) pressure.
- Circle size and intensity correspond to the magnitude of liquidity concentration.
This creates a clear, intuitive view of how trader sentiment develops and shifts as the market evolves.
BTC Indicator Example
Interpretation and insights
The main idea is this: observe how buy and sell pressure forms and shift near the spread.
For instance, between October 12th and 13th, we can observe a transition from weaker buy orders to stronger accumulation — potentially indicating growing bullish sentiment.
Such transitions don’t guarantee a move but often precede short-term directional shifts in price.
Strong and persistent liquidity clusters near the spread, coupled with visible shifts in trader behavior, can provide valuable insights into how market structure evolves in real time.
Why this matters
No indicator or model is perfectly accurate — markets are shaped by both liquidity conditions and human behavior.
However, by treating order book data as a mathematical representation of sentiment, we can uncover structural patterns that traditional, price-based analysis cannot detect.
Our Support and Resistance Detection Method provides a quantitative foundation for analyzing how liquidity, behavior, and sentiment interact, bridging economic principles with market microstructure.
What’s next
We plan to release the Order Book Sentiment Indicator in the upcoming months for peer review and testing.
The aim is to evaluate its effectiveness in capturing how liquidity and sentiment interact to influence price formation under real market conditions
Final thoughts
This approach offers a complementary perspective to traditional chart-based analysis by focusing directly on the order book — the underlying structure where market movement begins.
By observing how supply and demand evolve over time, we can develop a clearer understanding of how collective trader behavior translates into price dynamics.