Support and resistance levels are essential tools in technical analysis that help crypto traders identify key price zones where buying or selling pressure may emerge. Mastering these concepts can improve trade entries, exits, and risk management.
In this article, we’ll explore:
- What Is a Support Level?
- What Is a Resistance Level?
- Why Are Support and Resistance Important in Crypto?
- How to Identify Support and Resistance (Step-by-Step)
What Is a Support Level?
A support level is a price point where a cryptocurrency tends to find buying interest and stop declining. It acts like a psychological or technical “floor” where buyers enter the market, preventing further drops.
Common Traits of Support:
- Often identified by previous lows
- Strong volume at the level increases its reliability
- Can be horizontal or trendline-based
Example:
If Bitcoin falls to $25,000 multiple times but doesn’t go lower, that price becomes a support level.
How to Use Support in Trading:
- Buy entry: Near strong support
- Stop-loss: Just below support
- Confirmation: Use RSI or MACD to confirm bounce potential
What Is a Resistance Level?
A resistance level is where selling pressure typically exceeds buying pressure, causing the price to stall or reverse upward movement. Think of it as a “ceiling” for the asset.
Common Traits of Resistance:
- Often formed at previous highs
- Sellers dominate near this level
- Can be static or dynamic (e.g. moving averages)
Example:
If Ethereum hits $3,500 several times and retreats, that level becomes resistance.
How to Use Resistance in Trading:
- Take profit: Near resistance
- Short entry: On failed breakout attempts
- Wait for breakout: A close above resistance may signal a trend shift
Why Are Support and Resistance Important in Crypto?
Crypto markets are highly volatile, so identifying these levels helps manage trades better and avoid emotional decisions.
Key Benefits:
- Pinpoint entry and exit zones
- Manage risk and reward ratios
- Spot breakouts and fakeouts
- Build structured trade plans
Types of Support and Resistance
1. Horizontal Levels
- Based on past price highs/lows
- Easy to identify on charts
2. Trendlines
- Diagonal levels connecting rising lows (support) or falling highs (resistance)
- Help visualize dynamic market structure
3. Moving Averages
- Act as dynamic support/resistance zones (e.g., 50 EMA, 200 EMA)
4. Psychological Levels
- Round numbers like $1,000, $10,000, or $30,000
- Often attract significant market interest

Join us now!
Start your automated trading bots.

How to Identify Support and Resistance (Step-by-Step)
- Look at historical highs and lows on daily or 4H charts.
- Mark zones where price reversed multiple times.
- Use volume data to confirm interest at those levels.
- Combine with indicators like RSI, MACD, or Fibonacci retracements.
- Watch for price reactions at these levels (rejection, breakout, consolidation).
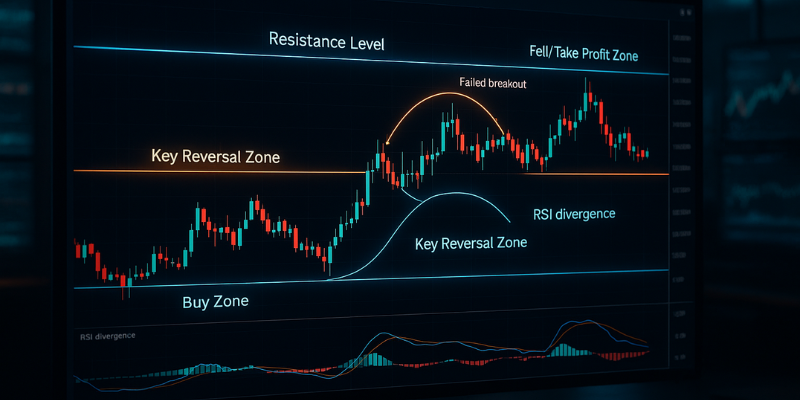
Support and Resistance in Real-World Trading
Bullish Example:
- BTC drops to $28,000 (support), shows RSI divergence, and bounces → long trade confirmed.
Bearish Example:
- ETH hits $3,200 (resistance) three times and fails to break → short opportunity with tight stop.
Final Thoughts: Support and Resistance in Crypto
Support and resistance levels are the backbone of crypto technical analysis. They provide valuable insight into market psychology and price behavior, making them essential for every trader’s strategy.