It can be overwhelming to learn about cryptocurrency, especially if you are fresh to trading charts. One of the most popular and richest sources of information among traders is the candlestick chart. It may seem intimidating at first glance, but learning candlestick pattern reading can give you a huge edge in understanding how markets move and making smarter trading choices.
Common candlestick patterns and what they mean
Understanding candlestick patterns can help you anticipate possible price moves. Here are a few beginner-friendly patterns to look out for:
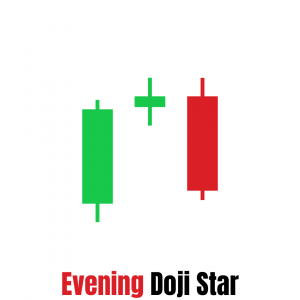
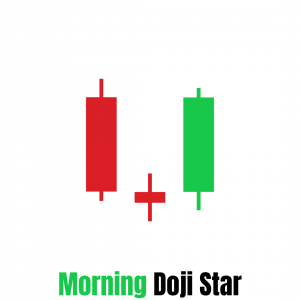
1. Doji
- Appearance: Very small or no body, open and close are nearly equal.
- Meaning: Indicates market indecision. Can signal a potential reversal when found after a strong trend.
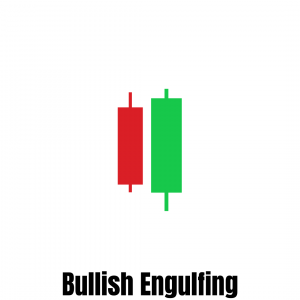
2. Bullish Engulfing Pattern
- Appearance: A small red candle followed by a large green candle that completely “engulfs” the previous one.
- Meaning: May suggest a reversal from a downtrend to an uptrend.
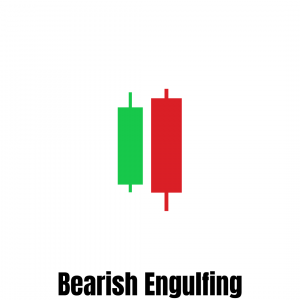
3. Bearish Engulfing Pattern
- Appearance: A small green candle followed by a large red candle that engulfs it.
- Meaning: Can indicate a reversal from an uptrend to a downtrend.

Welcome to effortless trading. Set your strategy.
Let it run
Welcome to effortless trading. Set your strategy.
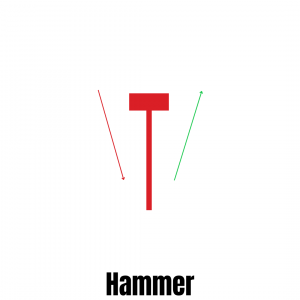
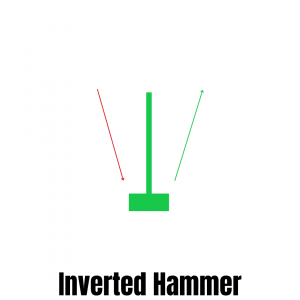
4. Hammer and Inverted Hammer
- Hammer: Small body at the top with a long lower wick.
- Inverted Hammer: Small body at the bottom with a long upper wick.
- Meaning: Can signal a potential trend reversal. Hammers are typically bullish signals when found at the bottom of a downtrend.
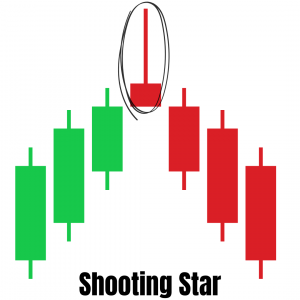
5. Shooting Star
- Appearance: Small body at the bottom with a long upper wick.
- Meaning: Potential bearish reversal when found at the top of an uptrend.
Tips for Beginners
- Start with Daily Charts: They are easier to analyze and give a better perspective on trends than shorter frames of time.
- Don’t Use Patterns Alone: Use candlestick analysis in conjunction with other indicators like volume, RSI, or moving averages to achieve greater precision.
- Practice with Simulations: Use demo accounts or charting programs like TradingView to perfect your skills without losing real money.
Final Thoughts
Candlestick patterns are the “language” of cryptocurrency charts. They inform you about the emotions behind the price action—fear, greed, indecision, or momentum. Practice and experience will have you pick up on these patterns easily and use them to improve trading decisions.
Read more about the types of candlestick chart model.
*This article is for educational and informational purposes only. The information presented should not be construed as financial advice. It is advisable to consult certified financial experts before undertaking any investment actions.