Cryptocurrency markets are notorious for their wild price fluctuations, and risk measurement is an integral component of every trade or investment strategy. Volatility, a quantitative measure of returns’ dispersion (variance), is perhaps one of the most fundamental tools in this time series analysis. Below, we’ll walk you through the basics – time series data, price returns, variance, standard deviation, and instruct you on how to create your volatility calculator.
What is time series data?
A time series is a flow of data points in time order. Traditionally, in crypto or traditional finance, it means previous price history – close prices, daily highs and lows, or even volume – recorded at regular intervals (e.g., hourly, daily, weekly).
Time series analysis is employed to identify trends, seasonality, and volatility in asset prices.
Understanding Price Returns
Price returns show how much the value of an asset changes over time. There are two main types:
1. Simple Returns
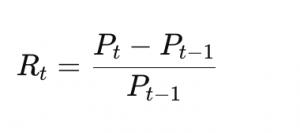
The simple return from one period to the next is calculated as:
 Eq.[1]
Where:
- Pt is the price at time t
- Pt−1 is the price at (t-1) the previous time step
Simple returns ARE NOT time-additive. They are preferred when:
- You care about actual percentage gains/losses
- You’re doing performance reporting
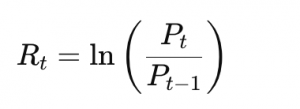
2. Log Returns
Logarithmic returns are preferred in quantitative finance for their mathematical properties, especially when dealing with compounding:
 Eq.[2]
Log returns ARE time-additive, making them useful for continuous compounding and modeling. They are preferred when:
- You’re doing statistical modeling or time-series analysis
- You need additive properties or assume normal distribution
What means for the returns to be additive (Example)?
You invest in a stock for two consecutive days:
- Day 0 Price: $100
- Day 1 Price: $110
- Day 2 Price: $121
Simple Returns (Not Additive):
Day 1 Return:
R1 = (110−100) / 100 = 0.10 = 10%
Day 2 Return:
R2 = (121−110) / 110 = 0.10 = 10%
Total Return over 2 days:
R = (121−100) / 100 = 0.21 = 21%
So if we follow the logical thing we can assume that R = R1+R2
But:
R1 + R2 = 0.1 + 0.1 = 0.2 = 20%; Not equal to 21% = R (Not Additive)
Log Returns (Additive):
Day 1 Log Return:
R1 = ln(110 / 100) ≈ 0.0953 = 9.53%
Day 2 Log Return:
R2 = ln(121 / 110) ≈ 0.0953 = 9.53%
Sum of Log Returns:
R = R1 + R2 ≈ 0.0953 + 0.0953 = 0.1906 = 19.06%
Total Log Return over 2 days:
ln(121 / 100) = ln(1.21) ≈ 0.1906 = 19.06%; Equal to 19.06% = R (Additive)
Standard Deviation: A Measure of Dispersion
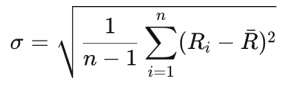
The standard deviation measures how spread out the returns are from their average. It’s calculated as:
 Eq.[3]
Where:
- Ri is the return at time i;
- R̅ is the average return;
- n is the number of observations;
- Use 1 / (n − 1) if you’re working with a sample of the population;
- Use 1 / n if you’re working with the entire population;
As we can see from equation [3] the Standard deviation is the square root of the variance. A high standard deviation means returns are more volatile and vary significantly from the mean. A lower value suggests more price stability.

Trust the algorithm:
Start now with your automated trading!

Volatility = Standard deviation
![]() Eq.[4]
Eq.[4]
Volatility: what it really means
Volatility is typically defined as the standard deviation of return over a period of time. It’s a gauge of how much an asset price fluctuates and it’s useful for quantifying risk.
- Daily volatility uses data on daily returns.
- Annualized volatility amplifies this on a square root of time basis:
![]()
Where:
- 252 is the number of trading days;
- Sigma daily is the daily volatility calculated with daily price returns;
Using this basic concept you can calculate different types of volatility based on your needs
Create your own volatility calculator (Python Example)
Here’s a simple Python code snippet using popular libraries like pandas and numpy:
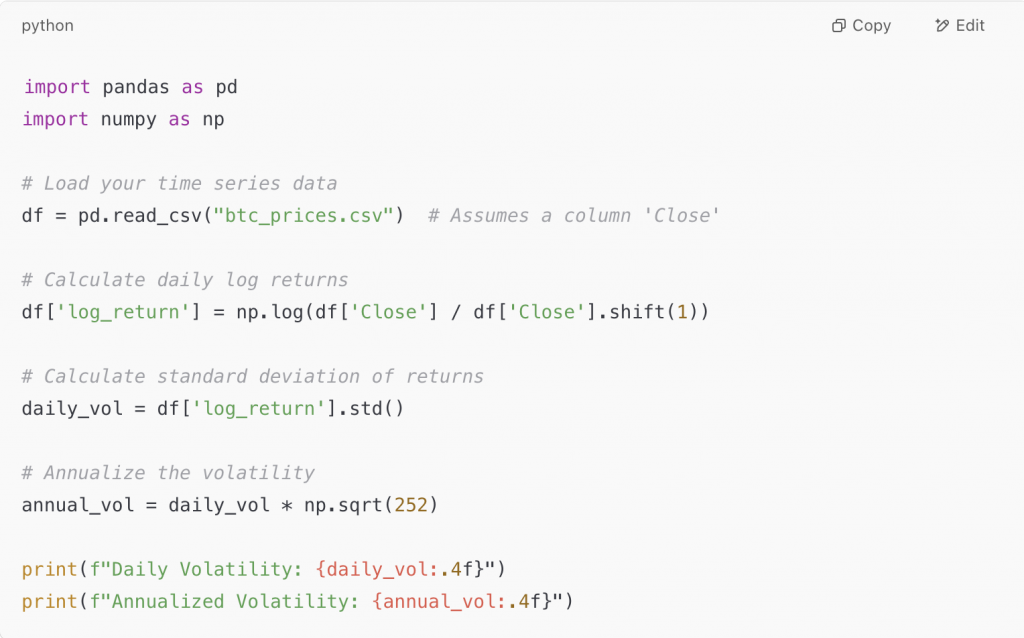
This script will give you both daily and annualized volatility for your asset.
Practical uses
- Portfolio Risk Management: Analyze how risky one asset is compared to others.
- Position Sizing: Use volatility to size positions better (e.g., less risk in higher-volatility assets).
- Strategy Formulation: Screen or select assets based on volatility levels for momentum or mean-reversion strategies.
Volatility calculation and comprehension are an essential skill for both traditional and cryptocurrency markets. Whether you’re managing a portfolio or building an automated trading strategy, it’s important to base your decisions on firm statistical foundations.
Being able to calculate volatility yourself gives you not only insights into asset behavior but also lays the groundwork for more advanced methodologies like Value-at-Risk (VaR), Sharpe Ratio, or GARCH modeling.