RSI, MACD, and moving averages are among the most widely used technical indicators in crypto trading. They help traders analyze price trends, identify potential entry and exit points, and make data-driven decisions in volatile markets.
Quick Overview:
RSI measures momentum, MACD highlights trend shifts, and moving averages smooth price data to show overall direction. Used together, these indicators offer a clearer picture of market behavior for smarter trading decisions.
What Is RSI (Relative Strength Index)?
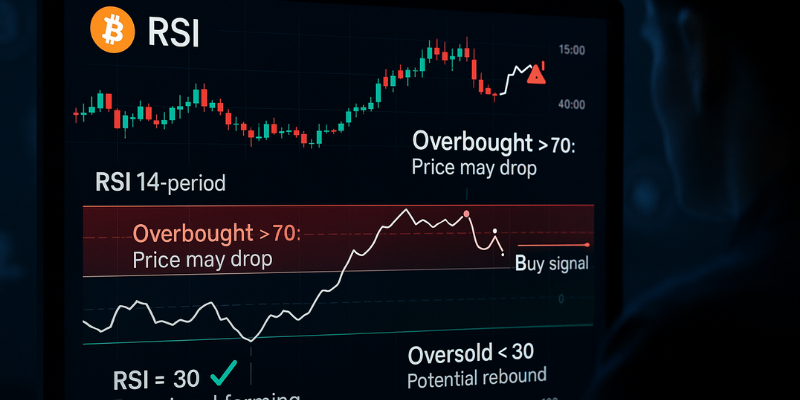
The Relative Strength Index (RSI) is a momentum oscillator that measures the speed and change of price movements.
Key RSI Details:
- Scale: 0 to 100
- Overbought: Above 70
- Oversold: Below 30
- Default setting: 14-period
RSI helps traders spot when a crypto asset is potentially overbought (too expensive) or oversold (undervalued). For example, if Bitcoin’s RSI hits 80, it might signal a short-term pullback.
How to Use RSI:
- Buy when RSI crosses above 30 from below.
- Sell when RSI crosses below 70 from above.
- Combine with trend indicators for stronger signals.
What Is MACD (Moving Average Convergence Divergence)?
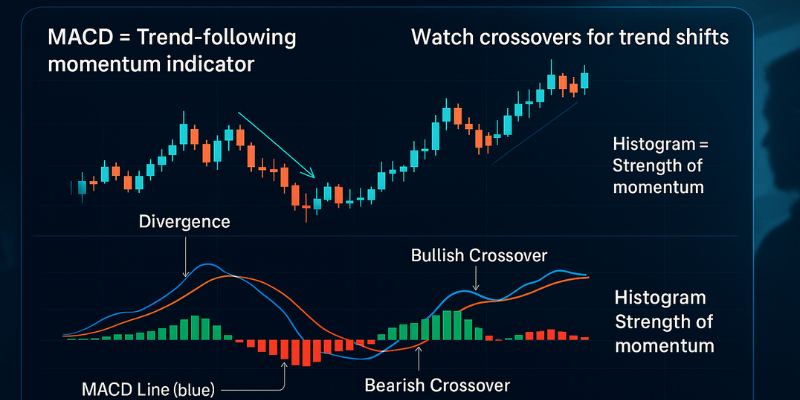
MACD is a trend-following momentum indicator that reveals the relationship between two moving averages of price.
Basics:
- Line 1: 12-period EMA
- Line 2: 26-period EMA
- Signal Line: 9-period EMA of MACD
- Histogram: Difference between MACD and Signal Line
MACD is effective at identifying trend momentum shifts, such as bullish or bearish crossovers.
How to Read MACD:
- Bullish Signal: MACD crosses above Signal Line
- Bearish Signal: MACD crosses below Signal Line
- Watch for divergence between price and MACD – often hints at trend reversals.
What Are Moving Averages?
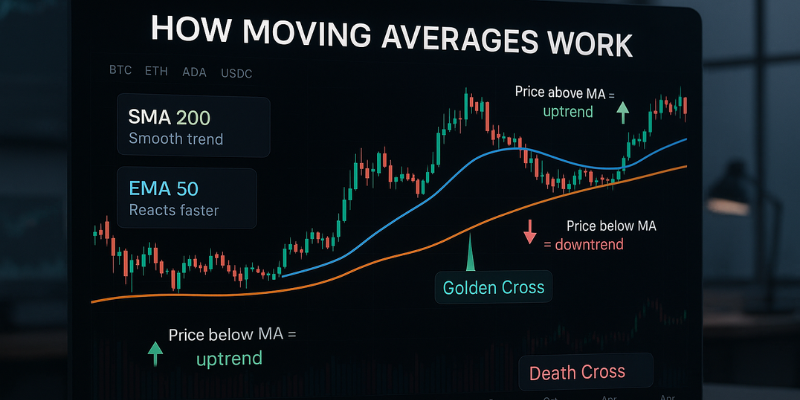
Moving averages (MA) are trend indicators that smooth price data over a selected period. They’re used to determine the direction of the trend and identify support/resistance levels.
Two Common Types:
- Simple Moving Average (SMA): Average price over a time period.
- Exponential Moving Average (EMA): More weight on recent prices; reacts faster.
Popular periods: 50-day, 100-day, 200-day
How to Use Moving Averages:
- Trend direction: Price above MA = uptrend; below MA = downtrend
- Golden Cross: 50-day MA crosses above 200-day MA (bullish)
- Death Cross: 50-day MA crosses below 200-day MA (bearish)
MAs are great for identifying long-term market sentiment and dynamic support or resistance levels.
Combining RSI, MACD, and Moving Averages
These indicators are more powerful when used together.
Example Setup:
- RSI shows momentum
- MACD confirms trend changes
- Moving Average shows long-term direction
Sample Strategy:
- Wait for MACD bullish crossover.
- Confirm RSI is rising but under 70.
- Ensure price is above the 50-day EMA for trend alignment.
This combination helps filter out false signals and improves trade timing.

Join us now!
Start your automated trading bots.

Pros and Cons of These Indicators
Advantages:
- Widely tested and trusted
- Good for both short- and long-term analysis
- Work well together for confirmation
Limitations:
- Can lag in fast markets
- Not predictive—only interpret past price data
- False signals during sideways movement
Always use risk management and never rely on a single indicator.
Final Thoughts: RSI, MACD, and Moving Averages in Crypto
Understanding RSI, MACD, and moving averages is essential for any crypto trader aiming to interpret market trends effectively. Each offers unique insights, and together they create a robust technical analysis toolkit.