When examining data, familiarity with relationships between variables is most important. One of the most powerful tools for exploring relationships between variables is the correlation matrix. It provides a graphic and statistical view of how different variables relate to each other. Two of the most widely used methods for measuring correlation are Pearson and Spearman. Both have advantages, depending on the nature of the data and the type of dependency being examined.
In this article, we’ll explain the intrinsic differences between Spearman and Pearson correlation in linear versus nonlinear relationships, tell you when to use what, and provide everyday usage examples so you can make the optimal choice for your analysis.
What is a correlation matrix?
A correlation matrix is a square matrix that presents the correlation between a number of variables. The matrix cell cites a correlation coefficient, which reveals the direction and degree of the linear connection between two variables. The coefficient value is usually in the range -1 (perfect negative correlation) to +1 (perfect positive correlation) with 0 as no correlation.

Pearson correlation matrix: suitable for linear relationships
Pearson correlation checks whether there is a linear association between two continuous variables. That is, to what extent can a straight line explain the association between them. If the association between the variables constantly increases or decreases at the same pace, then Pearson is the ideal test.
But Pearson is making the assumptions that data will be normally distributed and there are no outlying observations, as these would warp conclusions. It is best with ratio or interval scale data and when you are certain a linear relationship would be appropriate.
For example, Pearson correlation might be used to find out how advertisement expenditure is correlated with sales revenue, or how temperature increases influence energy consumption. Relationships between these variables usually (but not necessarily always) follow a linear path.
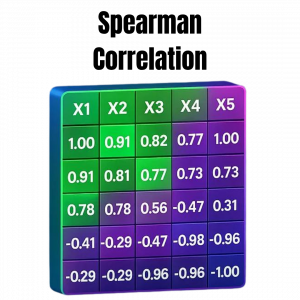
Spearman correlation matrix: suited for nonlinear or monotonic trends
Spearman correlation does depend on ranked values instead of raw data, though. This makes it especially suitable for the detection of monotonic relationships where variables would tend to move in the same direction but not necessarily by a constant rate.
In contrast with Pearson, Spearman does not rely on linearity or normality. It is less susceptible to the influence of outliers. It is thus most handy when data are composed of rankings, ordinal measurements, or nonlinear but monotonic trends.
For instance, Spearman correlation is a better choice when one is looking to study the relationship between the customer rating of a product and its position in a popularity list. Even if the increase in ratings does not lead to proportional increase in rank, Spearman will be able to pick up on the trend strength anyway.
Main difference: linear vs nonlinear character
The greatest difference between Pearson and Spearman is in the character of the relationship they assess.
- Pearson is meant for linear relationships. It will only churn out a high correlation coefficient if the rise (or fall) in one variable is accompanied by an equal, proportionate change in another.
- Spearman, on the other hand, can identify monotonic relationships, both linear and otherwise. Provided that the direction of the trend is consistent (i.e., as one variable increases, the other variable always decreases or increases), Spearman will capture it—irrespective of whether the rate of change is consistent or not.
This is a profound difference when dealing with complicated data sets where patterns are not necessarily linear.
When to use Pearson?
Use Pearson correlation when:
- Your variables are quantitative and interval or ratio scaled.
- The data is nearly normal or normally distributed.
- You want to know the strength of a linear relationship.
- You deal with fields such as finance, physics, or engineering where such relationships are common.
A real-life example would be seeing the impact of height on weight in adults or seeing the impact of GDP on energy consumption in developed countries.

Automate your crypto moves today. Smart trading starts here.

When to use Spearman?
Use Spearman correlation when:
- Your data is ordinal or non-normal.
- You are guessing a nonlinear but monotonic relation.
- Your data includes ranks, e.g., webpage rankings or survey scales.
- You need a test which is not as sensitive to outliers.
For example, Spearman is ideal for analysing ranked data. It works well when comparing student satisfaction ratings with university rankings. It’s also useful for comparing app download rankings to user-provided ratings.
Real-life application situations
- In advertisement, Pearson can be used to examine the influence of advertisement spending on monthly sales. Spearman, however, can be used to examine if products that receive higher ratings always get a higher ranking in search ranking even when the ranking improvements are non-linear.
- In psychology, Spearman is something researchers can use to see if greater anxiety ratings are associated with lower ranks in satisfaction with life. Since both variables may not be linear, Spearman gives a true representation.
Conclusion
It simply depends on the nature of your data and the nature of the relationship you’re trying to assess.
- If you have linear relationships and continuous normally distributed data, then Pearson’s your answer.
- If your data are ordinal, rank-ordered, or you have a hunch about nonlinear but monotonic relationships, then Spearman is the one.
It’s worth knowing the distinction between linear and nonlinear relationships: it will affect which kind of data you analyze and how you make decisions. Performing the right correlation method will give you more light and fewer dead ends.